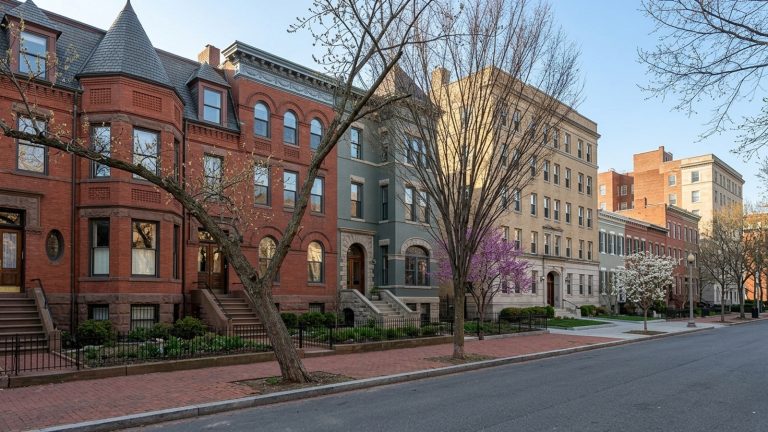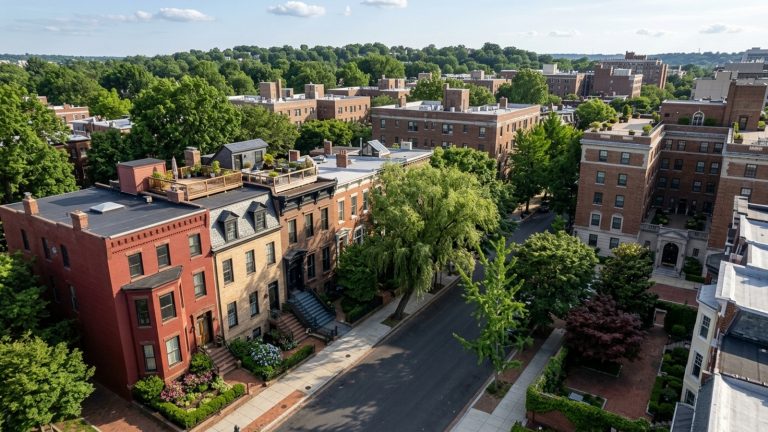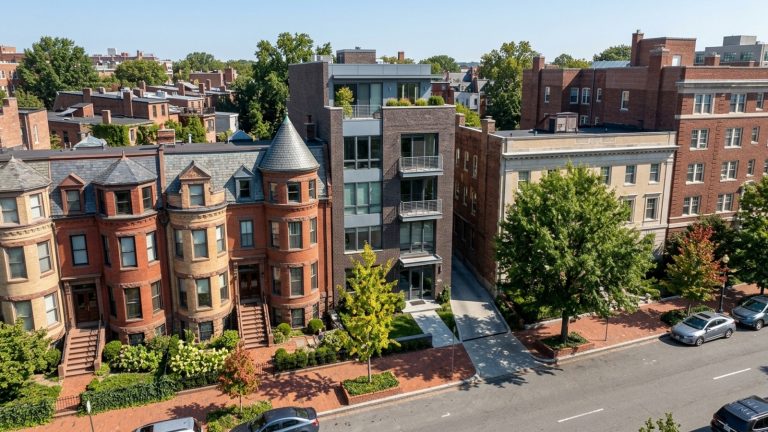

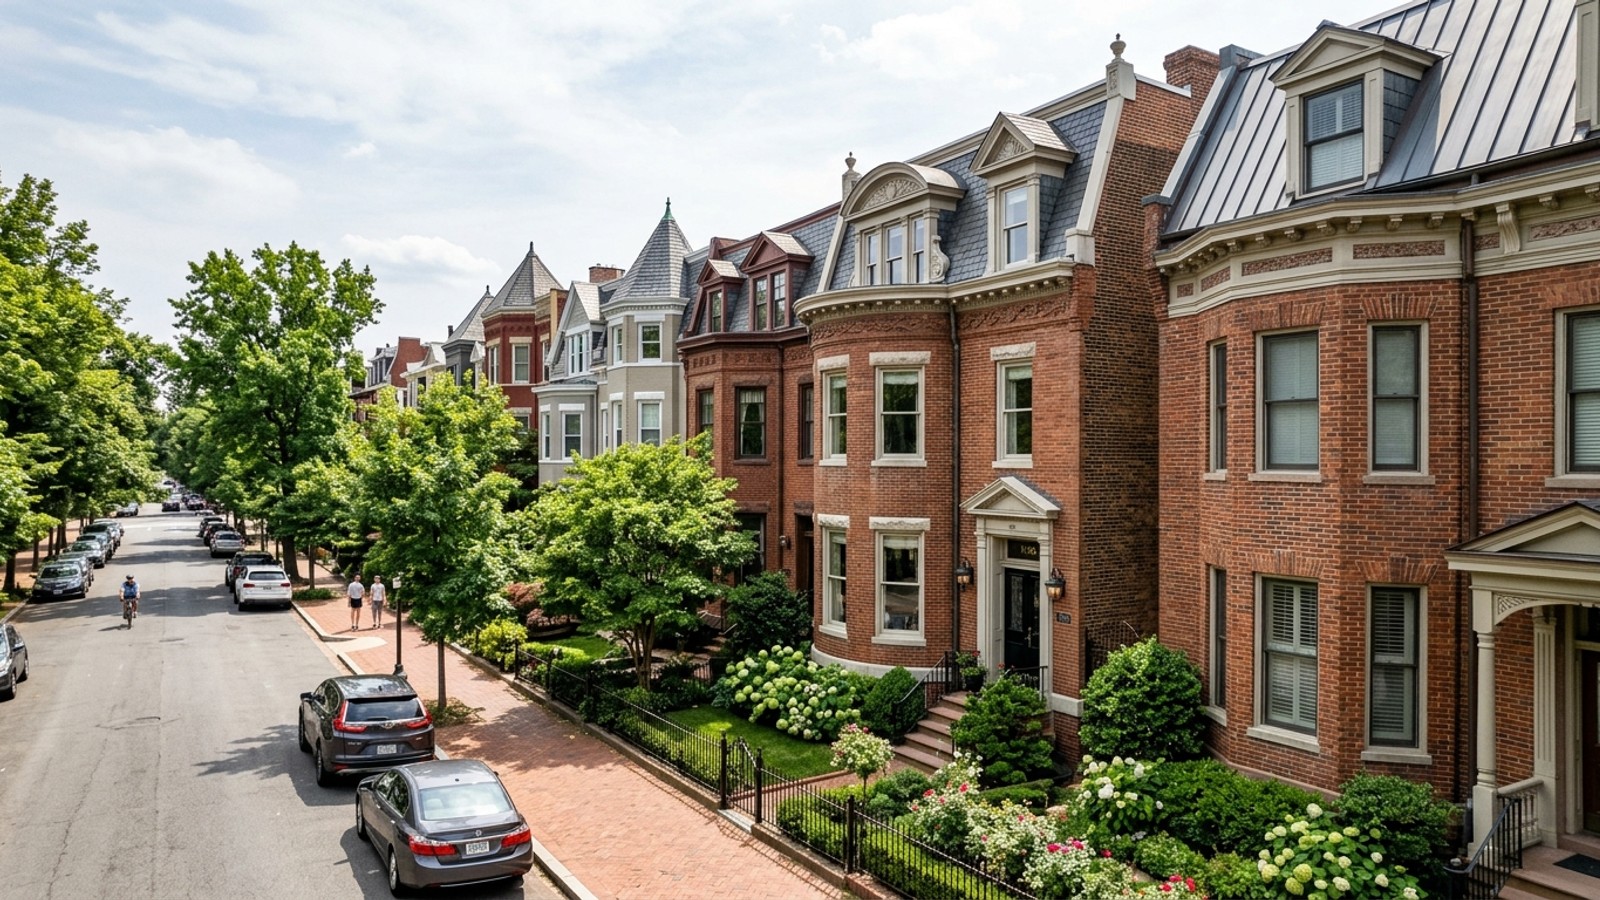
The cost of living in Dupont Circle, DC sits at an index of 164 – meaning overall expenses run about 56% higher than the national average. That’s not a rounding error. It reflects what it actually costs to live in the center of the nation’s capital, where housing demand has never really let up.
If you’re budgeting for a move here, housing is the biggest line item by a wide margin. After that, it’s district taxes and transportation. Whether the neighborhood makes financial sense for you comes down to one honest question: does your household income hold up against these numbers?
Dupont Circle Cost of Living at a Glance
Dupont Circle runs about 5% higher than the Washington, DC average – and nearly all of that gap comes from real estate. District-wide taxes and transit fares don’t change by neighborhood, so you’re not paying more for a Metro card because your building is on Connecticut Avenue. The premium is in the property.
The national baseline is set at 100. Dupont Circle’s 164 puts it well above most U.S. markets, and every major expense category trends above the national median. Because you’re in the District of Columbia rather than a Maryland or Virginia county, you won’t pay county taxes – but you will face district-level income and property assessments that shape your actual take-home pay in ways a lot of newcomers don’t anticipate.
Living here requires a higher baseline income than most American cities. That’s just the reality.
Housing Costs: Home Prices and Rent Payments
The median sale price for a home in Dupont Circle is approximately $540,000 as of mid-2026, up 12.5% year-over-year. Homes are spending roughly 54 days on the market before going under contract, and sellers are closing at about 98.5% of asking price. Deep discounts are rare here – you’ll know that after your second or third offer.
There were about 105 active listings in recent months, with 77 homes selling in a single one-month period. That ratio tells you something. Well-maintained properties see competitive bidding, and buyers who haven’t already factored in the district’s property tax rates into their monthly estimates tend to get surprised at closing.
On the rental side, the average rent runs around $2,477 per month – about 27% above the national average. Some 2026 estimates put that figure at $2,511, depending on the building and what’s included. Either way, you’re not finding a bargain.
Everyday Expenses: Utilities and Transportation
Electricity in Washington, DC runs around 23.72 cents per kilowatt-hour. Utility costs citywide sit 10% to 20% above the national average, which adds a consistent monthly drag to the budget. Since rates are set at the district level, Dupont Circle residents pay the same electricity and water rates as everyone else in DC. If you’re renting, it’s worth checking whether your building bundles water or heating into the lease – older buildings sometimes do.
Gas prices hover just 1% above the national average, though many residents here don’t drive daily. The transit network makes it easy not to. A one-way bus fare is $1.75, or $4 for the express. Subway fares range between $1.75 and $5.90 depending on time of day and distance. Predictable, and for most people, cheaper than owning a car in the district.
District of Columbia Tax Rates
The general sales tax rate in DC is 6.0% for 2026, applied across the district without additional local surcharges. That rate is scheduled to rise to 7.0% by October 2026.
Certain categories run considerably higher. Restaurant meals and liquor are taxed at 10% whether you’re eating in or taking out. Commercial parking carries an 18% tax. Hotel stays fall between 14.5% and 14.95%.
For property owners, the residential tax rate is $0.85 per $100 of assessed value, which produces an effective rate of about 0.6% to 0.63%. Given local property values, the median annual property tax bill lands between $4,225 and $4,594. Income tax operates on a progressive scale with seven brackets ranging from 4% to 10.75%, with no separate brackets for marital status.
Salaries and Household Incomes
The median household income in Dupont Circle is $123,178 per year. That number matters because it explains why the housing market holds where it does – the people living here can, for the most part, support these prices.
Earnings vary by age group. Residents between 25 and 44 earn a median income of $127,119. Those between 45 and 64 see the highest median at $137,896. Households under 25 and those 65 or older both average closer to $75,000 annually.
To afford the average rent without spending more than 30% of gross income on housing, you’d need to earn approximately $99,000 per year. Drop below that and housing starts taking up more of the budget than most financial advisors would recommend.
Why Prices Stay High in the Neighborhood
It’s a straightforward supply-and-demand story. About 105 active listings, 77 homes selling in a single period, and a buyer pool that skews toward six-figure earners. Sellers don’t need to negotiate much because they don’t have to.
The transit access matters too. The ability to get downtown without a car – and avoid that 18% commercial parking tax in the process – is something buyers consistently pay extra to secure. That’s not a marketing line; it shows up in the sale prices.
Comparing Dupont Circle to the Rest of Washington, D.C.
The 5% gap between Dupont Circle and the DC average is almost entirely a real estate story. A bus fare is $1.75 whether you’re boarding in Dupont Circle or anywhere else in the district. Groceries and electricity don’t reprice when you cross neighborhood lines.
What does shift noticeably by zip code is the mortgage payment. Buyers priced out of the $540,000 median often look at adjacent neighborhoods – but the entire district carries a high baseline cost of living and the same 6.0% sales tax. Moving a few streets over changes your housing cost. It doesn’t change much else.
Pros and Cons of Living in Dupont Circle, DC
The case for it: multiple bus lines, subway access, proximity to major district employers, and the practical ability to commute without a car. That transit convenience offsets some of the area’s higher expenses and means most residents aren’t writing checks to commercial parking operators at 18% tax.
The case against it: a 164 cost of living index, a $540,000 median home price, rents around $2,477 per month, and a 10% tax on every restaurant meal and drink. If you’re earning below the $123,178 neighborhood median, discretionary spending requires real discipline.
There’s no version of this neighborhood that’s a hidden deal. The question is whether what it offers is worth what it costs for your specific situation.
Frequently Asked Questions
What is the average monthly HOA fee for a condo in Dupont Circle?
HOA fees vary widely by building. The median home sale price is around $540,000, but association dues are separate from that figure and aren’t captured in the baseline property tax rate of $0.85 per $100 of assessed value. You’ll need to request the specific fee schedule for any building you’re considering.
How does the cost of buying a home in Dupont Circle compare to nearby Logan Circle?
Dupont Circle’s median sale price sits at roughly $540,000. For Logan Circle specifically, you’ll need to pull current neighborhood listings – the data doesn’t allow for a clean side-by-side comparison here.
How much extra should I budget for off-street parking when buying a property in Dupont Circle?
Commercial parking in the district carries an 18% tax. If you’re buying and want a deeded parking spot, expect it to add a premium on top of the $540,000 median purchase price – the amount depends on the specific property.
Are there hidden maintenance costs or historic preservation fees for older rowhouses in Dupont Circle?
The district applies a standard residential property tax rate of $0.85 per $100 of assessed value rather than special neighborhood fees. If you’re buying an older property, budget for standard maintenance and standard district property taxes.
Does living in Dupont Circle come with a higher premium for everyday expenses like groceries and dining out?
Dining out carries a 10% district tax on restaurant meals and liquor. The neighborhood’s overall cost of living index is 56% above the national baseline, though that gap is driven primarily by housing rather than everyday goods.
Do property values in Dupont Circle appreciate fast enough to offset the high initial purchase price?
Mid-2026 data shows the median sale price increased 12.5% year-over-year, with buyers paying about 98.5% of list price. Those figures reflect steady demand – but past appreciation doesn’t guarantee future results, and you should weigh that alongside your own timeline and financial situation.